The Missing Scale in a Newsworthy Number
Learn how to read a newsworthy number by checking its time span, comparison point and unit, so the figure means more than its headline suggests.
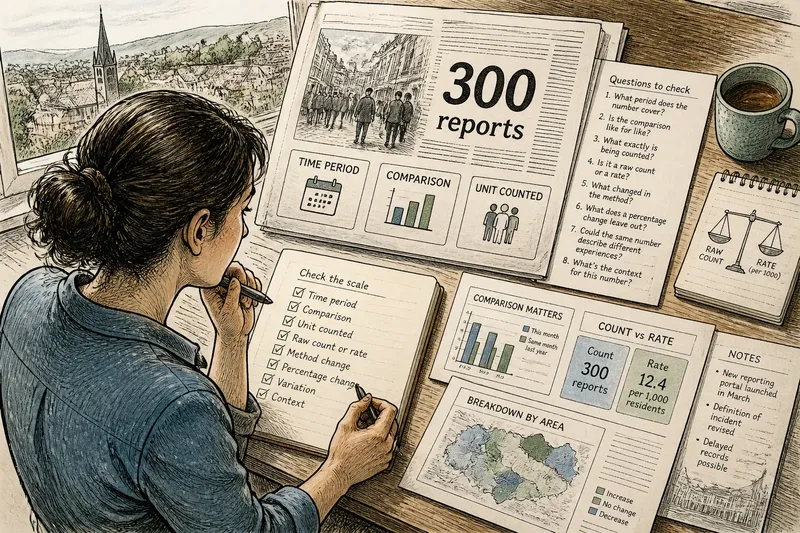
The common mistake with a newsworthy number is to treat it as self-explanatory. A report says a town recorded 300 complaints, and the figure feels alarming or reassuring before you know whether it covers a day, a year, one neighbourhood or the whole area. The number may be accurate; its scale is what lets you interpret it.
When a story turns data into a headline, three details often determine what the figure can tell you: the period it covers, the comparison used and the unit being counted. Check each before deciding whether a number signals a sharp change, a large burden or a meaningful difference. These eight questions offer a practical way to do that.
1. What period does the number cover?
A figure without a time span is difficult to place. “There were 300 reports” could refer to a single evening, a month or several years. Those are different claims even if the count itself is correct.
Look for the period in the sentence, caption, chart axis or notes beneath a graphic. Terms such as “so far”, “during the first quarter” and “over the past year” are not decoration: they set the boundaries of the count. If the period is missing, the article may be compressing detail that the original table or report provides.
Also check whether the period is complete. A count recorded up to Tuesday cannot be compared casually with a total for a full week. News reports sometimes use a running figure because the event is continuing; treat it as a snapshot with an unfinished boundary, not as a final total.
2. Is the comparison like for like?
A number becomes more informative when set beside another one. But the comparison must use compatible periods and definitions. Comparing this month with a full previous year, or one agency’s tally with another agency’s broader count, can make a change look more dramatic or more modest than it is.
Ask what the baseline is: the previous period, the same period last year, a long-term average or a target. Each answers a different question. A comparison with last month may show a recent shift; a comparison with the same month in another year can help account for recurring seasonal patterns. Neither automatically explains why the difference occurred.
Check whether the boundaries stayed the same. Did the organisation begin collecting reports from more locations, change its definition or include a new category? If so, a rise in the count may partly reflect a change in what is recorded rather than a change in the underlying activity.
3. What exactly is being counted?
“Cases”, “incidents”, “claims” and “people affected” sound concrete, but each may refer to a different unit. One person can make several claims; one incident can involve many people; an initial report may later be revised or removed. A count of records is not automatically a count of unique individuals.
Find the noun attached to the number and read its definition if the story links to a source. A police tally of recorded offences, for example, is not the same measure as a survey of people who say they experienced an offence. Both may be useful, but they capture different things and have different limits.
Where the article gives only a rounded figure, avoid reading precision into it. “About 300” may be enough to show the rough scale, but it cannot support a fine-grained comparison with a figure presented to the last unit.
4. Is it a raw count or a rate?
A raw count tells you how many events or records were counted. A rate relates that count to a population or another denominator, such as households, journeys or applications. The denominator is the number or group used as the basis for the comparison.
Raw counts can help show the total workload faced by a service. Rates can help compare places of different sizes. Neither replaces the other. A large city may record more incidents simply because many more people live there, while a smaller place may have a higher rate relative to its population.
When a report gives a rate, inspect what it is “per” and which population is included. A rate per resident is not interchangeable with one per household, and a rate based on eligible applicants describes a narrower group than one based on everyone in an area. The unit changes the question the figure answers.
5. What changed in the method of counting?
Numbers come from systems: forms, sensors, staff records, surveys or administrative databases. A change in the system can alter the count even if the underlying situation stays much the same. A new reporting route may make it easier to submit complaints; a revised form may capture categories that were previously missed.
Look for notes about revised definitions, data coverage, delayed records or changes in collection. These are often found in a linked bulletin or a chart’s small-print note rather than in the headline. If a series has a break, figures on either side may not be directly comparable.
This does not make the number useless. It means the interpretation should include the method change. A careful report may state that the count rose while also explaining that improved recording could account for part of the increase.
6. What does a percentage change leave out?
A percentage change describes how much a figure rose or fell relative to a starting point. It can make a small movement from a small baseline sound substantial, while a sizeable raw increase from a large baseline may appear modest in percentage terms.
Look for both the starting and ending counts. If a headline says reports doubled, ask whether the underlying numbers were a handful or a much larger total. The relative change may still matter, but the counts show the scale of the change in ordinary units.
There is no need to do elaborate arithmetic from a headline. The useful habit is simply to ask whether the story supplies the baseline and the resulting count. Without them, the percentage is hard to judge.
7. Could the same number describe different experiences?
An overall total can hide variation across time, place or group. A national figure might combine areas where the count rose with others where it fell. A monthly average can conceal a brief surge followed by a quieter period. The total may be accurate while offering little detail about where the change is concentrated.
Check whether the story links to a breakdown and whether the categories are meaningful for the question at hand. A regional table may reveal that the change is concentrated in one area, but it will not necessarily explain the cause. Avoid assuming that a pattern in one group applies to everyone.
Imagine a council report says it received 120 housing repair requests in a quarter. The count is accurate, but it is unclear whether requests came from 120 homes or included repeat requests from the same tenants. If the notes show that the unit is requests, not households, the reader can describe the service workload without claiming that 120 separate homes were affected.
8. Which detail should you check first?
When a number is central to a story, use this quick sequence of questions:
- Time span: What dates or period does the count cover, and is that period complete?
- Comparison: What is the baseline, and does it cover a comparable period and population?
- Unit: Is the figure counting people, events, records, claims or something else?
- Denominator: If it is a rate, what group or quantity is it measured against?
- Method: Did definitions, coverage or collection procedures change?
- Breakdown: Does an overall figure hide meaningful differences between places or groups?
- Precision: Is the figure rounded, provisional or subject to revision?
Check the details that could change the story’s main claim first. For a claim about a sudden rise, the comparison period and any method change may matter most. For a claim about which place is most affected, the unit and denominator deserve attention.
What should you look for in a newsworthy number?
Where can I find the time span?
Start with the sentence containing the figure, then check the chart axis, caption and linked source. If those places do not specify dates, treat the time period as unresolved rather than guessing from the publication date.
How can I tell whether a comparison is fair?
Compare the periods, definitions and populations on both sides. If one of those changes, the figures may still be useful, but they do not offer a clean comparison on their own.
Does a rate tell me more than a raw count?
It tells you something different. A raw count gives the total recorded volume; a rate relates that volume to a stated denominator, which can help compare differently sized groups.
What if the source does not explain the unit?
Check the original table or report for a methods note or definition. If the unit remains unclear, describe the figure only as the source presents it and do not turn records into claims about distinct people or events.
What is not worth the effort?
It is rarely useful to hunt for a single “true” number when different sources count different units or cover different periods. Nor does every article need a full audit of its data. Focus on the missing detail that could change the interpretation, and follow the source link when the figure carries the central claim.
The missing scale is often a small piece of context with a large effect on meaning. Before repeating a newsworthy number, name its period, comparison and unit as plainly as the story allows. That short description makes clear what the figure supports—and where its reach ends.